Skip to main content
MAVCOR
Search
Menu
MAVCOR Journal
MAVCOR Journal
About
Review Process
Submission Guidelines
Editorial Board
Volumes
User Galleries
Material Objects Archive
Material Objects Archive
About
Submission Guidelines
User Galleries
MAVCOR Digital Spaces Project
Guided Tours
Happenings
Happenings
Project Cycles
Project Cycle I: Sensational Religion
Project Cycle II: Material Economies of Religion in the Americas
Conferences
Religion and Film Series
Sensory Cultures Research Group
News & Events
The Center
Resources
Places, Materials, Projects
Syllabi
Material and Visual Cultures of Religion
Materialities & Secularization Theory
Collaborators
Contact
MAVCOR Logo
Center for the Study of
Material
&
Visual Cultures of Religion
M
A
V
C
O
R
Log in
Create Account
Search
MAVCOR Journal
MAVCOR Journal
About
Review Process
Submission Guidelines
Editorial Board
Volumes
User Galleries
Material Objects Archive
Material Objects Archive
About
Submission Guidelines
User Galleries
MAVCOR Digital Spaces Project
Guided Tours
Happenings
Happenings
Project Cycles
Project Cycle I: Sensational Religion
Project Cycle II: Material Economies of Religion in the Americas
Conferences
Religion and Film Series
Sensory Cultures Research Group
News & Events
The Center
Resources
Places, Materials, Projects
Syllabi
Material and Visual Cultures of Religion
Materialities & Secularization Theory
Collaborators
Contact
You are here
Home
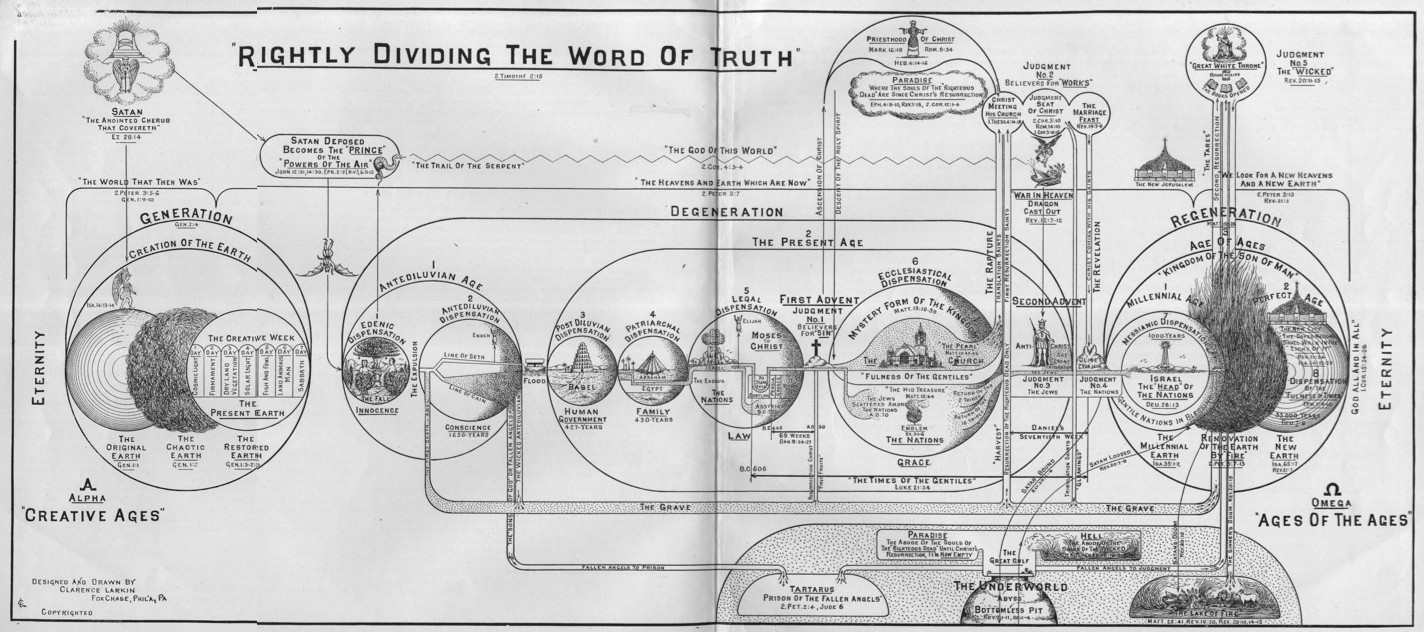
coates_image.jpg
coates_image.jpg